Understand the signal
Begin with water context and contamination, then work through the organisms themselves—what they are, how they reach water, and which of them are used as indicators.
01Fresh water is finite, unevenly available, and essential to public health, ecosystems, agriculture, and industry.
Water quality is a local decision with global consequences.
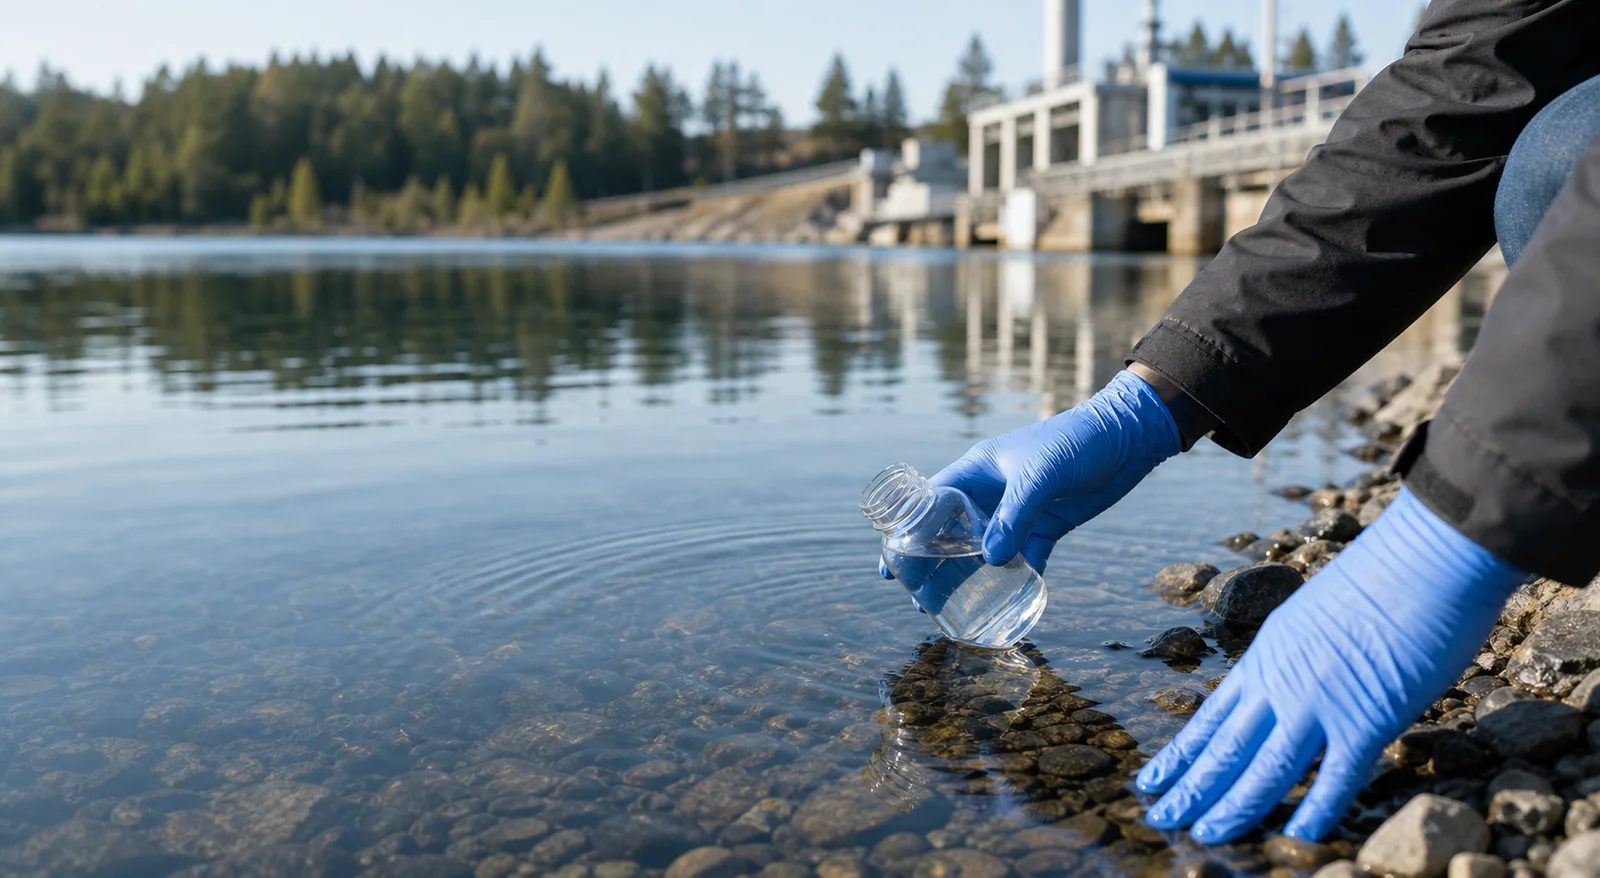
Water can look clear and still contain chemical or microbiological contaminants. Assessing whether it is suitable for a particular use requires evidence: information about the source, treatment process, distribution system, and representative samples.
Water covers roughly 71% of the planet's surface, but only about 2.5% of it is fresh water. Much of that is locked in glaciers and polar ice, held in the atmosphere and soil, stored underground, or too polluted to consume, leaving approximately 0.5% of the earth's water available for use. Supplies are finite in a way that day-to-day access can disguise.
In 2010 the United Nations recognized the human right to safe drinking water and sanitation. Judging water acceptable for drinking draws on many factors at once—clarity, taste, chemical composition, and the presence of microorganisms.
More than 2 billion people use a drinking water source contaminated with feces, associated with roughly 829,000 deaths each year. Diarrheal disease claims the lives of about 5,000 children every day worldwide, and unsafe drinking water is the leading contributor, linked to nearly 1,200 of those deaths daily.
These burdens are not distributed evenly, and developing countries carry a disproportionate share. Water safety in developed countries still warrants attention: boil water advisories are routine in parts of North America, particularly in rural and lower-income communities, and are issued whenever water is known or suspected to be unsafe.
The consequences of microbiologically polluted water are severe, ranging from the effects of cholera on the skin through diarrhea and dysentery to loss of life.
Advisories carry costs beyond the inconvenience. Long-term advisories erode community trust in the water supply, place a financial burden on families who turn to bottled water, and sustained boiling can raise indoor humidity and encourage mold. At any given time, one in five Indigenous communities in Canada is under some form of drinking water advisory. Overcrowding and limited running water are associated with methicillin-resistant Staphylococcus aureus (MRSA), the main antibiotic-resistant infection affecting Indigenous people disproportionately.
Communities with limited laboratory access, long transport distances, or constrained infrastructure can face a different monitoring reality from large urban systems. That makes accessible, well-designed testing workflows an important part of broader water management.
02A contaminant changes the physical, chemical, biological, or radiological character of water; pollution interferes with beneficial use or ecosystem function.
Understanding contamination and pollution.
Pollution occurs when a substance—chemical or microbiological—enters an ocean, stream, lake, river, estuary, or groundwater and interferes with the beneficial use of that water or the natural function of the ecosystem. Energy released into water as heat or radioactivity is treated the same way.
Potential sources include untreated wastewater, sewage overflows, agricultural and stormwater runoff, damaged distribution infrastructure, industrial discharges, natural mineral deposits, and poor storage or handling. Emerging contaminants such as pharmaceuticals, personal care products, and microplastics add to the picture.
Microbiological contamination deserves particular attention because disease-causing organisms may be introduced through human or animal waste. Monitoring programs use sampling plans, treatment controls, operational records, and laboratory or field tests together to understand risk.
Untreated municipal wastewater is the single largest contributor of excess nutrients and microorganisms to water ecosystems. Roughly 80% of the world's wastewater, most of it untreated, is released into the environment, and about 159 million people drink directly from untreated surface water such as streams and lakes.
The pattern differs by region. Many developed countries contend with eutrophication, heavy metals, nitrates, emerging contaminants, and salinity while their overall water quality has improved. Developing countries often face rising pollution as urban populations grow, consumption increases, and more untreated wastewater reaches the environment.
- Physical: sediment, turbidity, and suspended material
- Chemical: nutrients, metals, pesticides, salts, bacterial toxins, and human or animal drugs
- Biological: bacteria, viruses, protozoa, fungi, and algae
- Radiological: naturally occurring or introduced radioactive substances such as caesium, plutonium, and uranium
03Quality is judged against intended use, in terms of physical, chemical, and biological characteristics—not against a single universal standard.
Water quality is a measure of fitness for a specific use.
Any substance that alters the properties of water so that it is no longer beneficial or safe, or that threatens ecosystem function, is a contaminant. What counts as acceptable depends on what the water is for: drinking, irrigation, industrial process use, and recreational contact carry different requirements.
The consequences of poor quality extend past direct health effects into economic and social conditions. The World Bank has estimated that water pollution can reduce economic growth by up to a third in affected regions, with knock-on effects for food production and poverty.
This is why monitoring and testing sit at the center of assessing water quality, and why microbiological contaminants receive particular attention: their health effects are the most immediate and the most pronounced.
- Aesthetic: water may taste unpleasant or carry an odour
- Cosmetic: effects on skin, hair, or appearance
- Acute health effects: symptoms appearing hours or days after consumption
- Chronic health effects: harm accumulating over years of exposure
04Many microbes are harmless or beneficial. Pathogens are organisms capable of causing disease in a host.
Pathogens are the harmful subset of microorganisms.
Microorganisms are living things measured in micrometers or smaller—roughly ten times finer than a human hair and invisible without a microscope. Most are harmless, and many are essential to human and environmental health; yogurt, for instance, is produced by exposing milk to Lactobacillus acidophilus.
The subset capable of harming a host are pathogens. That harm may come from competing with the host for metabolic resources, destroying cells and tissues, or producing toxins.
Testing every possible pathogen in every sample is rarely practical. Water programs therefore use indicator organisms and other parameters to reveal whether contamination may have occurred or whether treatment and distribution controls are working as intended.
The organisms and limits relevant to a specific system depend on jurisdiction, source, intended use, treatment process, and the monitoring plan established by qualified professionals.
- Bacteria: common single-celled microorganisms
- Viruses: microscopic parasites that reproduce inside a host
- Protozoa and parasites: organisms living on or inside another organism
- Fungi: including yeasts and molds
- Algae: aquatic organisms capable of photosynthesis
05Frequency of occurrence and severity of harm together determine which organisms are monitored most closely.
What can be present in drinking water.
Bacterial organisms of concern include Escherichia coli, coliforms both fecal and non-fecal, Legionella pneumophila, Salmonella, Campylobacter species, and Vibrio cholerae. E. coli is itself a fecal coliform.
Viral organisms include the enteroviruses—poliovirus, echovirus, and coxsackieviruses—along with hepatitis A, adenovirus, astrovirus, rotavirus, norovirus, and other caliciviruses. Viruses excreted in urine, such as polyomaviruses and cytomegalovirus, can potentially spread through water. Transmission of influenza and coronaviruses through drinking water has been suggested, but the evidence remains inconclusive.
Protozoa and parasites include Cryptosporidium, Giardia lamblia, Toxoplasma gondii, Entamoeba histolytica, Cyclospora cayetanensis, Isospora belli, Blastocystis hominis, Balantidium coli, Acanthamoeba, Sarcocystis, and Naegleria species.
Fungi are treated as nuisance organisms in most monitoring guidelines rather than being heavily regulated, which does not mean they are acceptable in water. Species found in tap water include Aspergillus, Candida, Exophiala, Fusarium, Malassezia, Ochroconis, Penicillium, Phialophora, Phoma, Rhinocladiella, Cryptococcus, Rhodotorula, and black yeasts of the genus Aureobasidium. Harmful algal blooms form a further category.
These organisms can cause illness ranging from mild to severe when present above the maximum contaminant levels set in drinking water regulations, and elevated levels reaching the environment can also harm ecosystems. Because testing for each one is impractical, indicators are chosen to signal that a problem may exist.
The United States Environmental Protection Agency regulates turbidity, E. coli, and Total Coliforms as those indicators. Turbidity is the cloudiness of water rather than an organism, but it provides an environment where pathogens can grow and it interferes with disinfection. A revised rule proposed in 2010 replaced the maximum contaminant level for Total Coliforms with one for E. coli, alongside requirements for monitoring, assessment, and corrective action.
- Present whenever pathogens are present in the water
- Larger in number than the specific pathogens themselves
- Straightforward to analyze in a water sample
- Faster and less expensive to test than individual pathogens
- Able to survive in water at least as well as the pathogens they stand in for
- Absent when the water is not contaminated
| Pathogen | Source | Illness |
|---|---|---|
| Bacteria | ||
| E.coli | Sewage overflow, an Improperly working sewage system, Agricultural runoff, Stormwater runoff, Flooding (8,9) | Gastroenteritis, Pneumonia,Urinary tract infection |
| Legionella Pneumophila | Presence in water distribution systems, Construction, Water main breaks, Changes in municipal water quality, Biofilm, Scale and sediment, Water temperature fluctuations, pH fluctuations, Inadequate levels of disinfectant, Changes in water pressure, Water stagnation (10) | Legionellosis: Pontiac Fever, Legionnaires’ Disease |
| Salmonella | Sewage overflow, an Improperly working sewage system, Agricultural runoff, Storm water runoff, flooding (11) | Gastroenteritis, Salmonellosis, Typhoid, Reactive Arthritis |
| C. jejuni | Sewage overflow, Improperly working sewage system, Agricultural runoff, Storm water runoff, flooding12 | Gastroenteritis, Campylobacteriosis |
| Viruses | ||
| Poliovirus | Sewage overflow, an Improperly working sewage system (mainly from humans), Overland runoff, underground seepage (13) | Paralytic poliomyelitis |
| Rotavirus | Sewage overflow, an Improperly working sewage system (from humans), Stormwater runoff, Flooding (14) | Gastroenteritis |
| Hepatitis A. | Sewage overflow, Inadequately treated water and wastewater (15) | Liver inflammation |
| Protozoa | ||
| Cryptosporidium | Sewage overflow, an Improperly working sewage system, Agricultural runoff, Stormwater runoff, Flooding (16) | Cryptosporidiosis (may include fever, diarrhea and vomiting), More severe harm to digestive or respiratory tract in immunocompromised persons |
| Giradia Lamblia | Sewage overflow, an Improperly working sewage system, Agricultural runoff, Stormwater runoff, Flooding (17) | Giardiasis |
| Fungi | ||
| Aspergillus | Inadequately treated water or wastewater and the presence of organic materials, pH change, Water temperature fluctuations, Changes in water hardness, Changes in chemical composition of water (6,18) | Aspergillosis |
| Fungi from the genus Exophiala | Sewage overflow, Inadequately treated water or wastewater and the presence of organic materials, pH change, Water temperature fluctuations, Changes in water hardness, Changes in chemical composition of water (6,18) | Traumatic cutaneous infections, Keratitis, Onychomycosis, Otitis externa, Lung infections in patients with cystic fibrosis, Disseminated mycosis in immunocompromised patients, even involving the brain (6) |
| Algae | ||
| Phytoplanktons causing HAB | Nutrient pollution in the form of excess nitrogen and phosphorus caused by: Agriculture, Stormwater, Inadequately treated Wastewater, Fossil fuels, Household runoff (19) | Eye, skin, nose, throat and respiratory irritation (20), HAB toxin poisoning from eating contaminated seafood (21) |
06The route into the water usually explains more about risk than the organism alone.
How bacteria reach water in the first place.
Escherichia coli, coliforms, Legionella pneumophila, Salmonella, and Campylobacter species are among the bacteria that find their way into water and cause illness in humans and animals.
The most common routes are inadequate water treatment, sewage overflow, an improperly working sewage system, agricultural runoff, stormwater runoff, and flooding. Changes in the physical and chemical properties of water can also play a part. In drinking water specifically, faulty piping in the distribution network can introduce pathogens after treatment.
The resulting illnesses range widely—gastroenteritis and infectious diarrhea, pneumonia, urinary tract infection, legionellosis, typhoid, campylobacteriosis, and cholera among them.
The sections that follow look at individual species and their effects, and then turn to water management. Treatment and quality monitoring, including sample testing, remain the most effective means of preventing waterborne disease.
07A large group of Gram-negative, rod-shaped bacteria, naturally present in the intestines of humans and animals.
E. coli: the organism behind the indicator.
E. coli cells are roughly 1–2 micrometers long and 0.5 micrometers in radius. They occur naturally in the environment and in the intestinal tract, and are also found in food and water. Gram-negative bacteria carry peptidoglycan in the cell wall and lose the crystal violet stain during Gram staining.
Most strains are harmless. Some cause urinary tract infection and pneumonia, and a subset belongs to the Shiga toxin-producing group known as STEC, also called VTEC or enterohemorrhagic E. coli. The most commonly identified STEC strain is O157:H7, where O157 and H7 refer to its antigens, though several other pathogenic strains and pathotypes also cause illness.
Transmission occurs through ingesting contaminated food or water, contact with cattle, or contact with the feces of infected people. Because E. coli lives in the digestive tract, it reaches rivers, lakes, and private wells through sewage overflow, failing sewage systems, agricultural and stormwater runoff, and flooding.
Even small quantities can cause illness, so the maximum contaminant level in drinking water is non-detectable in 100 mL, and some international guidelines state it as zero per 100 mL.
Survival depends heavily on conditions. At 14–20°C, E. coli survives less than one to ten weeks in natural surface waters; in groundwater at 10°C it may persist for three to fourteen weeks. Because temperature, sunlight, and available nutrients all shift those figures, regular and frequent monitoring matters more than any single measurement.
08A family of Gram-negative, rod-shaped bacteria whose definition depends on the standard method used to detect them.
Coliform bacteria and what their presence signals.
Coliforms belong to the family Enterobacteriaceae. Each standard method defines the group slightly differently, and the three definitions describe roughly equivalent groups spanning several genera.
Total Coliforms covers both fecal and non-fecal organisms—that is, whether or not they originate in feces. Non-fecal coliforms occur naturally and are found nearly everywhere, and not all coliforms are pathogenic.
Their value lies in what their presence implies. As indicator organisms they signal the possible presence of pathogens and the safety of the water, and they help assess how effectively treatment is working. This matters most for sources feeding drinking water supplies.
Health Canada sets the maximum acceptable concentration for Total Coliforms leaving a treatment plant, and in non-disinfected groundwater leaving the well, as undetectable per 100 mL. The World Health Organization, the US EPA, and the European Union apply the same threshold wherever water is disinfected.
Coliforms survive in water from days to months depending on conditions, and are normally present in larger numbers than other microorganisms. That combination is what makes them well suited to their role as indicators.
- SM 9221, multiple-tube fermentation: facultative anaerobic, Gram-negative, non-spore-forming, rod-shaped bacteria that ferment lactose with gas and acid formation
- SM 9222, membrane filtration: organisms that develop red colonies with a metallic sheen on an Endo-type medium containing lactose
- SM 9223, enzyme substrate: bacteria possessing the enzyme ß-galactosidase, which cleaves a chromogenic substrate
| Coliform genus | Fecal | Non-fecal |
|---|---|---|
| Escherichia | Yes | Yes |
| Enterobacter | Yes | Yes |
| Klebsiella | Yes | Yes |
| Budvicia | No | Yes |
| Leclercia | No | Yes |
| Citrobacter | Yes | Yes |
| Pantoea | No | Yes |
| Serratia | No | Yes |
| Erwinia | No | Yes |
| Hafnia | Yes | Yes |
09Naturally present in fresh water at low concentrations; a health risk once it colonises a building system.
Legionella pneumophila and building water systems.
Legionella species are Gram-negative, non-spore-forming, aerobic rods with a non-fermentative metabolism, requiring L-cysteine and iron salts to grow. Free-living cells measure 0.3–0.9 micrometers wide and about 1.3 micrometers long, growing to 2–6 micrometers outside the body and forming filaments up to 20 micrometers.
Small quantities in fresh water are not normally a concern. The risk arises when Legionella enters building water systems, where strains such as L. pneumophila can cause legionellosis—either Legionnaires' disease, a form of pneumonia presenting with cough, fever, shortness of breath, muscle aches and headache, or the milder Pontiac fever.
There are no reports of person-to-person transmission. Infection commonly follows inhalation of aerosols from contaminated water. Reported cases of Legionnaires' disease in the United States rose 350% between 2000 and 2016; the CDC notes the cause is unclear, and points to greater awareness and testing, increased susceptibility, more Legionella in the environment, or some combination. The WHO estimates 10–15 cases per million people across Australia, Europe, and the United States, though many countries lack the means to report.
Risk is not evenly shared. Travellers over 50, current and former smokers, people with chronic lung conditions, and those who are immunocompromised face higher risk.
Legionellae multiply inside protozoa, and some cyanobacteria genera encourage their growth. In natural environments other than thermal and tropical waters, concentrations stay below 1 CFU/mL because replication rates are low. In building and distribution systems held between 20°C and 50°C they colonise readily, surviving in aerosols for hours and persisting longer in water even in harsh conditions.
Because the organism grows and metabolises slowly, laboratory detection is correspondingly slow and can take up to 14 days. Biosensor and PCR-based approaches are being developed toward more rapid detection. With no vaccine available, regular testing, maintenance, cleaning, and adequate disinfection of water systems, cooling towers, faucets, and filters remain the practical controls.
- Presence in water distribution systems, construction work, and water main breaks
- Scale, sediment, and biofilm formation
- Water temperature fluctuations, particularly between 25°C and 42°C
- pH fluctuations and changes in municipal water quality
- Inadequate disinfectant levels, changes in water pressure, and stagnation
10Named for its curved shape, from the Greek kampylos, curved, and baktron, rod.
Campylobacter: a leading cause of bacterial diarrheal disease.
Campylobacter belongs to the family Campylobacteraceae. The cells are Gram-negative, non-spore-forming, non-fermenting rods that are microaerophilic—requiring oxygen, but less than the atmosphere provides. They measure 0.2–0.9 micrometers in diameter and 0.5–5 micrometers in length, occasionally reaching 8 micrometers.
C. jejuni is a common cause of food poisoning and is found in poultry and animal feces. Consuming contaminated food or water can cause gastroenteritis and campylobacteriosis, with fever, diarrhea, and abdominal pain. Together, C. jejuni and C. coli rank among the leading causes of bacterial diarrheal disease worldwide, with 96 million cases recorded in 2010.
While much of the disease burden comes from contaminated food, water is also a route. Animal feces reach water through sewage overflow, failing sewage systems, agricultural and stormwater runoff, and flooding.
Survival in water depends on temperature, dissolved organic matter, and dissolved minerals, so persistence varies with local conditions—studies have observed some strains surviving up to 80 days in artificial water.
11One of four key global causes of diarrheal disease, and a major contributor in both developed and developing countries.
Salmonella in water and food.
Salmonella are Gram-negative, non-spore-forming, fermenting rods of the family Enterobacteriaceae, and facultative anaerobes—able to grow with or without oxygen. Cells typically measure 0.7–1.5 micrometers in diameter and 2–5 micrometers long.
Species such as S. enterica, to which almost all pathogenic Salmonella belong, cause gastroenteritis, salmonellosis, typhoid, and in some cases reactive arthritis that persists after the infection resolves.
Some serotypes, classified by microbial surface characteristics, are confined to particular animals or regions; others occur in many animals worldwide. Transmission follows contaminated food and water, or oral contact with contaminated feces from humans or animals.
Sewage overflow, failing sewage systems, agricultural runoff, stormwater runoff, and flooding all introduce Salmonella to water, where it can survive for months depending on conditions.
12Indicator organisms provide a practical signal about fecal contamination, treatment performance, and distribution-system integrity.
Why E. coli and Total Coliforms are widely used indicators.
E. coli is associated with the intestinal tract of warm-blooded animals and is commonly used as an indicator of recent fecal contamination. Total Coliforms describe a broader group found in the environment and in fecal material; their presence can signal a need to investigate treatment, storage, sampling, or distribution conditions.
Both also stand in for the effectiveness of the water or wastewater treatment systems in place, which is why millions of samples from treatment units, distribution systems, and treated effluents are tested every year as routine checks.
An indicator result is not a complete diagnosis on its own. Interpretation should consider sample location, collection procedure, controls, applicable regulations, and confirmation or follow-up requirements.
Build a defensible measurement
Connect system controls, treatment processes, established standard methods, and representative sampling into one quality-minded workflow.
13Effective programs connect source protection, treatment, distribution, monitoring, response, and communication.
Water management is a continuous control loop.
Water management, part of the broader idea of water cycle management, means planning and managing water resources for optimal use, with the goal of protecting people, animals, and the environment. Water quality management is one aspect of it.
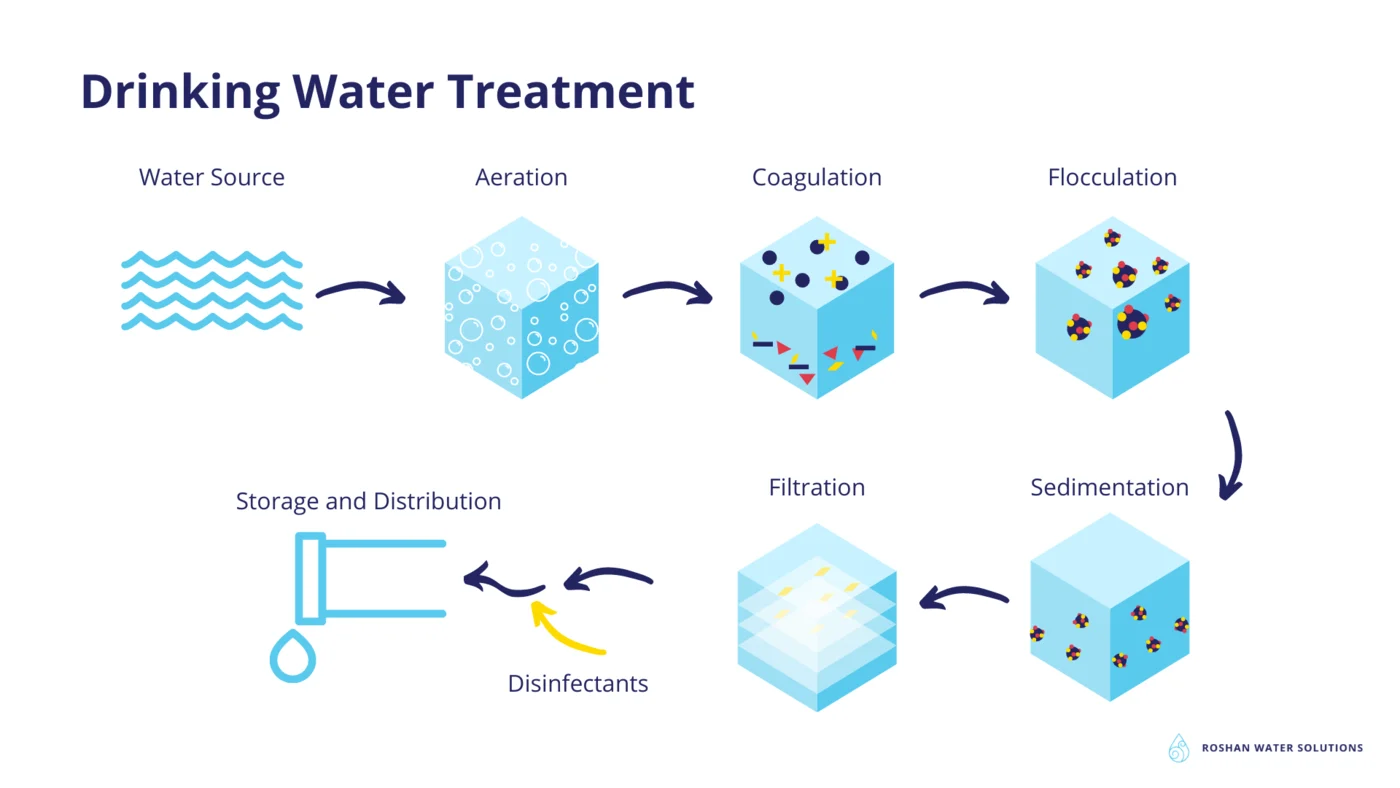
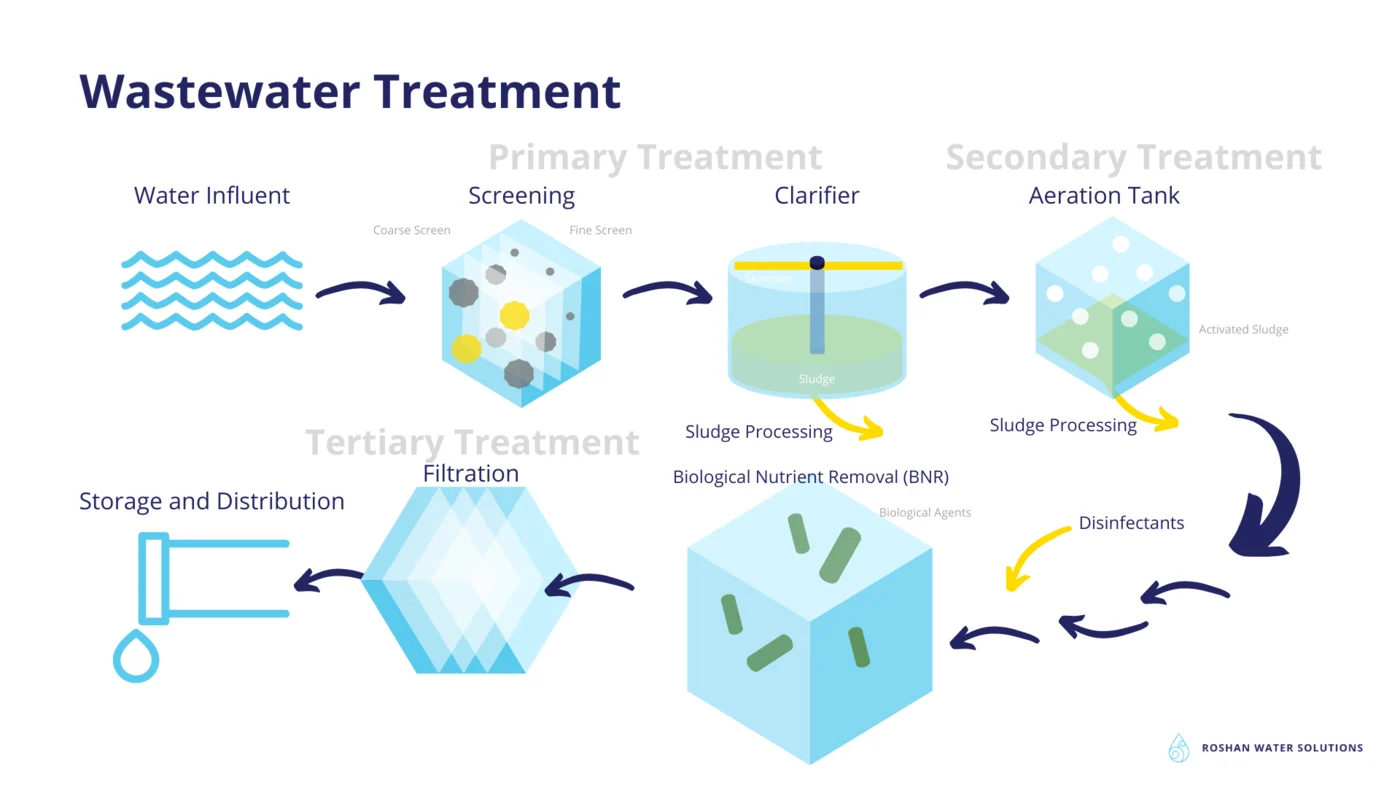
Treatment is the process of improving water quality for its intended use, by removing pollutants or reducing their concentration. The two main forms are drinking water treatment, which prepares water for human consumption, and wastewater treatment, which prepares water for release into the environment or, in more advanced processes, for reuse.
Testing contributes evidence at each stage. Results can help establish baseline conditions, confirm process performance, reveal trends, investigate unusual events, and support decisions about corrective action.
Water stress—where demand exceeds available supply, or quality restricts use—is intensified by climate change, population growth, demographic shifts, and increasing urbanisation. The UN's Sustainable Development Goal 6 targets universal and equitable access to safe and affordable water by 2030. Wastewater reuse and recycling, quality monitoring, and conservation all contribute. The economic case runs alongside the human one: some 263 million people spend at least 30 minutes per round trip collecting water, time that could go to more productive activity.
- Plan representative sampling locations and frequency
- Use documented collection, preservation, and chain-of-custody procedures
- Review controls and results against the applicable method
- Record context and respond through an established water-safety plan
Drinking-water treatment
- Source
- Coagulation
- Sedimentation
- Filtration
- Disinfection
- Distribution
Wastewater treatment
- Collection
- Screening
- Primary treatment
- Biological treatment
- Disinfection
- Discharge or reuse
14Coagulation and flocculation, sedimentation, filtration, and disinfection, applied in sequence.
The drinking water treatment process.
In coagulation and flocculation, positively charged chemicals are added to water. Dirt and dissolved particles carry a negative charge and repel one another; the added chemicals neutralise that charge so particles bind together into larger clusters called floc. Aeration often precedes this step, introducing air to thin layers of water or bubbling it through to remove dissolved gases and oxidise some metals.
Sedimentation allows the heavier floc to settle at the bottom of the tank. Because many microorganisms attach to dissolved particles, this stage carries them down too: between 27% and 84% of viruses and 32% to 87% of bacteria can be removed through coagulation, flocculation, and sedimentation together.
During filtration, the clearer water above the settled floc passes through a series of sand, gravel, and charcoal filters of varying pore size, removing smaller particles including dust, some microorganisms, and chemicals.
Those steps cannot remove every remaining biological contaminant, which is why disinfection comes last. Chlorine or chloramine is added to the filtered water before it leaves the plant for distribution. More recently, ultraviolet treatment has replaced chlorination in some plants, largely over concerns about disinfection by-products and their potential health and environmental effects. UV units raise both capital and operating costs, so chlorination remains the common choice.
The quality of the incoming water determines how much treatment is required. Surface water from lakes, rivers, and streams carries more sediment and pollutants than groundwater and is more likely to contain contaminants, so it needs more treatment and filtration.
- Coagulation and flocculation
- Sedimentation
- Filtration
- Disinfection
15Primary, secondary, and tertiary stages, applied according to volume and plant capability.
The wastewater treatment process.
The environment absorbs small amounts of pollution, but not an overwhelming load. With roughly 80% of the world's wastewater released largely untreated, 159 million people drinking directly from untreated surface water, and rivers, lakes, and oceans supporting both recreation and aquatic life, treatment matters for people and ecosystems alike. Because the sources and purposes differ from drinking water, so does the process.
Primary treatment is physical and mechanical—sedimentation, screens, sieves, and thermal methods. Solids are removed first, carrying up to 35% of the pollutants with them; screens with roughly 1 cm openings catch larger items such as sticks, leaves, and paper.
Wastewater then rests in settling tanks, or clarifiers, for several hours. Scum floats to the surface and sludge settles to the bottom; both are removed, and can be treated separately to produce biofuels. Approximately half of fecal coliforms are removed at this stage, and biological oxygen demand falls by about 50%. A plant's efficiency is judged on how much suspended solids and BOD it removes.
Secondary treatment uses bacteria, with oxygen, to consume and break down contaminants—through aeration, anaerobic treatment, biochemical oxidation, lagoons, or sludge digestion. Also called the activated sludge process, it removes 85% to 90% of BOD and suspended solids and 90% to 95% of coliform bacteria. Some facilities add a sand filter, after which the water is disinfected with chlorine, ozone, or UV before discharge.
Tertiary treatment, often called advanced treatment because not every plant can perform it, applies physical, chemical, and biological processes to remove organic matter, metals, dyes, and the nutrients phosphorus and nitrogen. Processes include biological nutrient removal, nitrification-denitrification, and filtration ranging from ultrafiltration and microfiltration to nanofiltration and reverse osmosis. In biological nutrient removal, bacteria digest pollutants across tanks held at different oxygen levels, removing phosphorus while ammonia breaks down to nitrate and nitrogen gas.
Smaller communities sometimes rely on lagoons or septic tanks for primary treatment before release, allowing time for settlement and letting biological agents in the soil break down contaminants where land is available. These methods can prove inadequate: shallow lagoons in particular leave too little space for full settlement and are not suited to long-term storage.
16Sampling and analyzing water for its various constituents and conditions, against a shared body of validated methods.
Water quality monitoring and the standard methods.
Monitoring covers both pollutants introduced by human activity—oil, pesticides, metals—and natural constituents such as dissolved oxygen, nutrients, and microorganisms.
It serves several purposes at once: confirming that water meets the requirements of its intended use, detecting problems early when a chemical or microbial concentration rises suddenly, identifying specific pollutants and tracing them toward a source, and establishing trends when the same constituents are measured routinely over time.
Standard Methods for the Examination of Water and Wastewater exists to make those measurements comparable. The collection has been maintained and updated continuously since 1905 and now holds more than 400 methods, produced jointly by the American Public Health Association, the American Water Works Association, and the Water Environment Federation.
1000Introduction
This chapter is intended to provide overall information regarding the methods described in the rest of the collection. General guideline about quality assurance strategies, data quality, collection and preservation of samples, laboratory occupational health and safety as well as waste minimization and waste disposal strategies have been provided in this chapter. However, in each of the following parts, the second chapter always describes the specific quality assurance/quality control measures.
2000Physical and Aggregate Properties
Methods described in this chapter are used to determine overall physical properties of water samples, regardless of what specific constituents are present in water. Physical properties are used in this chapter in contrast to chemical composition, radioactivity or microbiological properties. However, it is mentioned that in some cases, it is difficult to distinguish between physical properties and chemical properties as both are intertwined. For example, tests for determination of the taste of water samples are included in this chapter although taste is heaviliy dependent on the chemical composition of water.
- Appearance
- Color
- Turbidity
- Odor
- Taste
- Flavor profile analysis
- Acidity
- Alkalinity
- Calcium carbonate saturation
- Hardness
- Oxidant demand/requirement
- Conductivity
- Salinity
- Floatables
- Solids
- Temperature
- Particle counting and size distribution
- Asbestos
- Oxidation-reduction potential
- Tests on sludges
- Abaerobic sludge digester gas analysis
- Dissolved gas supersaturation
3000Metals
The effects of the presence of metals in water and wastewater covers the whole range from being essential to the growth of plants and animals, to damaging the treatment processes and finally, imposing toxicity to the users. Moreover, for some metals, the shift in the type of the effects can depend on the concentration. As a result, this part describes a variety of methods that can be used for detection and quantification of metals in water samples depending on the complexity of the water matrix as well as required level of sensitivity and precision. Methods described in this part can be divided into two general categories of colorimetric methods and instrumental methods. As the name suggests, colorimetric methods quantify the metals in a water sample by measuring the degree of color formation in the sample when one specific metal reacts with a specially designed reactant used in the testing process. For example, in colorimetric determination of aluminum in water, Eriochrome cyanine R is used as the reactant. Colorimetric methods are usually simpler and more cost effective compared to instrumental methods · however, they are prone to interferances of other water constituents with the reactant. For instance, phosphate is a known interfering agent in colorimetric detection of aluminum mentioned above. Instrumental methods include tests such as atomic absorption spectrometry, flame photometry, nductively coupled plasma emission spectrometry, anodic stripping voltammetry. The choice of method is heaviliy dependent on the specific metal being detected, complexity of the water matrix, as well as desired detection range. For example, flame atomic absorption methods are normally suited for detection range of 0.1-10 mg/l while more complicated methods such as inductively coupled plasma mass spectrometry can offer detection as low as 0.01 µg/l.
- Aluminum
- Arsenic
- Calcium
- Chromium
- Copper
- Iron
- Lead
- Lithium
- Magnesium
- Manganese
- Potassium
- Selenium
- Sodium
- Strontium
- Vanadium
- Zinc
- Other metals (Only contain background information for other matals not included here and refer the reader to the appropriate methods)
4000Inorganic Nonmetalic Constituents
As opposed to the previous part, this part of the standard methods deals with the detection and quantification of non-metalic inorganics. In general, this part describes classical wet chemical techniques and their more modern automated variants in quantification of nonmetalic inorganics (e.g. ion chromatography, continuous flow analysis, flow injection analysis, capillary ion electrophoresis) . Of particular importance are methods in quantifcation of constituents such as chlorine, nitrogen and phosphorusSince chlorination is one of the most used disinfection methods in treatment of drinking water, detection of chlorine and its residuals in the treated drinking water and the receiving distribution system is of utmost importance. The presence of residual chlorine (in pre-determined concentration range) in the distribution system can be used as a proxy for assuring the sanitary condition of the water. However, it does not and should not replace the use of microbiological tests described in part 9 (especially Total Coliforms and E.coli).
- Boron
- Bromide
- Carbon dioxide
- Cyanide
- Chlorine (residual)
- Chloride
- Chlorine dioxide
- Fluoride
- pH value
- Iodine
- Iodide
- Iodate
- Nitrogen
- Nitrogen (ammonia)
- Nitrogen (nitrite)
- Nitrogen (nitrate)
- Nitrogen (organic)
- Oxygen (dissolved)
- Ozone (residual)
- Phosphorus
- Potassium Permanganate
- Silica
- Sulfide
- Sulfite
- Sulfate
- Peracetic acid (residual)
- Hydrogen peroxide
5000Aggregate Organic Constituents
In general, determination methods of organic matters in water and wastewater can be categorized in two groups. This part of standard methods deals with methods that analyze samples for aggregate organics properties. This means that methods presented in this part are concerned with quantification of overall concentration of organic compounds that have common chemical characteristics, regardless of their individual composition. These methods have many applications in analysis of raw & treated wastewater samples since they can assess the efficiency of the treatment process. Methods for quantification of individual organic compounds are presented in the next part. · Some of the most important methods described in this part are: · -Total organic carbon and chemical oxygen demand for analyzing the total amount of organic compounds present. · -Biochemical oxygen demand for assessing the fraction of organic matters that are biodegradable. · -Oil & grease which are defined as all organic compounds that can be extracted from the sample by non polar solvents.
- Biochemical Oxygen Demand (BOD)
- Chemical Oxygen Demand (COD)
- Total Organic Carbon (TOC)
- Dissolved organic halogen
- Auatic humic substances
- Oil & grease
- Phenols
- Surfactants
- Tannin and lignin
- Organic and volatile acids
- Trihalomethanes and other disinfection byproducts
- UV-absorbing organic constituents
6000Individual Organic Compounds
Methods presented in this part are complicated methods for detection and quantification of individual organic compounds at very low concentrations. As a results, for each method, stringent QA/QC protocols have been prescribed. Pre-concentration methods have been instrumental in achieving low levels of detection of organic compounds in water samples. In general, before using methods described here, a pre-concentration step is required to extract organic molecules from a large volume of water sample. Then analysis is done on a much smaller volume of extracted sample. Close-loop Stripping Analysis (CLSA), purge and trap technique and Solid-Phase Micro Extraction (SPME) are the most well-know pre-concentration methods used for preparation of the extracts for analysis. The extracts can be analyzed using Gas Chromatography (GC) or Liquid Chromatography (LC) connected to one of several Mass Spectroscopic (MS) detectors.
- Volatile organic compounds including:
- -Methane
- -1,2-dibromoethane (EDB) and 1,2-dibromo-3-chloropropame (DBCP)
- -Trihalomethanes and chlorinated organic solvents
- -Disinfection byproducts: haloacetic acids and trichlorphenol
- -Disinfection byproducts: aldehydes
- Extractable base/neutrals and acids including:
- -Phenols
- -Polychlorinated biphenyls
- -Polynuclear aromatic hydrocarbons
- -Nitrosamines
- Carbamate pesticides
- Organochlorine pesticides
- Acidic herbicide coumpounds
- Glyphosphate herbicide
- Tributyl tin
- Pharmaceuticals and personal care products
7000Radioactivity
Radioactivity in water and wastewater samples can stem from natural occurrence as well as human activities. Human activities that can cause the contamination of water and wastewater with radioactive compounds can range from medical and industrial use of radioisotopes to mining and processing of nuclear fuel-related material and atmospheric testing of the nuclear devices. · Testing protocols of water and wastewater samples for radionuclides can range from simple gross alpha and gross beta sreening to more sophistacted methods such as gamma spectroscopy. Gross screening measurements can be inexpensive, simple and quick. This is why these screening methods are normally used to obtain initial assessment and to determine whether further testing of the samples is required. However, these screening methods are subject to bias especially if a high concentration of dissolved solids is present in the sample. Moreover, they do not provide the isotopic composition of the sample and cannot be used to estimate radiation does. To determine the isotpoic composition and radiation dose, more complicated procedures such as gamma spectroscopy is required after the initial screening assessment.
- Radioactive cesuim
- Radioactive Iodine
- Radium
- Radon
- Total radioactive strontium and strontium-90
- Tritium
- Uranium
8000Toxicity
Toxicity tests are important parts of water and wastewater monitoring programs since chemical and physical tests described in previous parts alone do not provide information on the potential effects of contaminations on aquatic biota. Moreover,when exposed to the same level of toxic compounds, the level of susceptibility vary between various aquatic species. Toxicity tests may be used to determine: · – Suitability of environmental conditions for aquatic life · – Effect of environmental parameters on the level of toxicity of compounds · – Toxicity of specific wastes to specific test species · – Relative susceptibility of aquatic species receiving a potentially toxic effluent · – The effluent discharge rate allowed to be received by an aquatic environment
- Mutagenesis
- Bacterial bioluminescence
- P450 reporter gene response to dioxin like organic compounds
- Comet/single-cell gel electrophoresis assay for detection of DNA damage
- Sediment porewater testing
- Algae
- Biostimulation (algal productivity)
- Phytoplankton
- Marine macroalgae
- Aquatic flowering plants
- Duckweed
- Aquatic emergent plants
- Ciliated protozoa
- Rotifers
- Annelids
- Mollusks
- Arthropods
- Daphnia
- Ceriodaphnia
- Mysids
- Decapods
- Aquatic insects
- Echinoderm fertilization and development
- Fish
- Fathead minnow
- Amphibians
9000Microbiological Examination
The methods described in this part of the Standard Methods provide information about the microbiological content of water samples. Since microbiological content of samples are sensitive to the sampling procedures and the sample transportation conditions, the first five chapters of this section are devoted to precise QA/QC procedures, exact laboratory equipment needed for the test methods, how to prepare the equipment through adequate washing and sterilization, preparation of the culture media for methods using such media and, proper sampling and handling. Of particular importance are methods for testing water samples for Total Coliforms and E.coli. This is due to the fact that both Total Coliforms and E.coli are principal indicators of the suitability of water for domestic, industrial or other uses. Test methods (SM 9221, SM 9222 and SM 9223) for detection and quantification of these indicators in water and wastewater samples have become routine methods in any environmental laboratories that test water and wastewater samples, especially drinking water samples. These methods will be explored in more details in the next section of this article. · This part of the Standard Methods also includes test procedures for differentiating various species in the Total Coliforms group. However, for drinking water applications, the differentiation of coliforms is of a very limited use since the presence of the Total Coliforms in a drinking water sample renders that water source unsuitable for use, regardless of the exact species present. Although it has to be mentioned that differentiation methods for drinking water can yield valuable information about the source of the pollution or how the distribution system is colonized. · Heterotrophic Plate Count (HPC) methods are also included in this part. These methods provide an approximation of viable bacteria concentration in a water sample without identifying the types. These methods can be used in water treatment plants as in-house testing of the efficiency for various treatment processes or in standard laboratories for testing the quality of the reagent-grade water system. · Test methods for isolating certain pathogenic bacteria or protozoa are also described in this part. These methods are normally very complicated and only used when detailed investigation of waterborne diseases or study of watershed are required.
- Rapid detection methods
- Stressed microorganisms
- Recreational waters
- Heterotrophic plate count
- Direct total microbial count
- Assimilable organic carbon
- Aerobic endospores
- Multiple-tube fermentation technique for Members of the coliform group
- Membrane filter technique for members of the coliform group
- Enzyme substrate coliform test
- Detection of coliphages
- Differentiation of coliform bacteria
- Fecal enterococcus/streptococcus groups
- Iron and sulfur bacteria
- Nitrifying bacteria
- Detection of actinomycetes
- Detection of pathogenic bacteria
- Detection of enteric viruses
- Detection of fungi
- Pathogenic protozoa
10000Biological Examination
The primary goal of this part of the standard methods is to describe protocols for field sample collection and laboratory analysis of water samples to establish the status of the aquatic species present and interpret the effect of current and past contaminations on these species. In other words, while previous parts of the Standard Methods deal with detection and quantification of various pollutants in the water, this part describes how those contaminants (such as turbidity or a chemical substance) can affect these aquatic communities. The aquatic species investigated here are extra to the ones mentioned in the previous section (see the parameter tested for this part). Some of the uses of the information produced by the test protocols in this part are: · – To help interpret chemical analysis, for example, the presence or absence of certain biological species can point toward oxygent deficiency or supersaturation in water samples · – To explain the source of taste, odor, color or visible particulates in the water · – To help in design and operation of water and wastewater treatment plant by investigating the source of the clogging in pipes and filters · – To evaluate the nature and extent of pollutions · – To evaluate the status of self-putification in waterbodies
- Plankton
- Periphyton
- Macrophytes
- Benthic macroinvertebrates
- Fishes
- Benthic meiofauna
- Nematological examination
- Identification of aquatic organisms
17Central laboratories use validated methods, controlled conditions, trained personnel, and quality systems to produce defensible results.
Established microbiological methods remain foundational.
Part 9 of the Standard Methods is dedicated to microbiological examination. Within it, the methods for detecting and quantifying Total Coliforms and E. coli carry the most weight, because those organisms serve as the microbial indicators in water quality management and reflect how well treatment systems are removing microorganisms.
Three methods are dedicated to that task: SM 9221, multiple-tube fermentation; SM 9222, membrane filtration; and SM 9223, the enzyme substrate test. The sections that follow give a general overview of each. Detailed protocols and procedures belong to the Standard Methods reference document itself.
Method selection depends on the sample matrix, target organisms, required detection range, turbidity, regulatory framework, turnaround needs, and laboratory capability. Portable tools should be evaluated as part of this wider method and quality context.
Multiple-tube fermentation
Statistical concentration estimate from positive reactions across dilution series.
Membrane filtration
Capture from a known volume, selective growth, and colony counting.
Enzyme substrate
Colour or fluorescence produced through target enzyme activity.
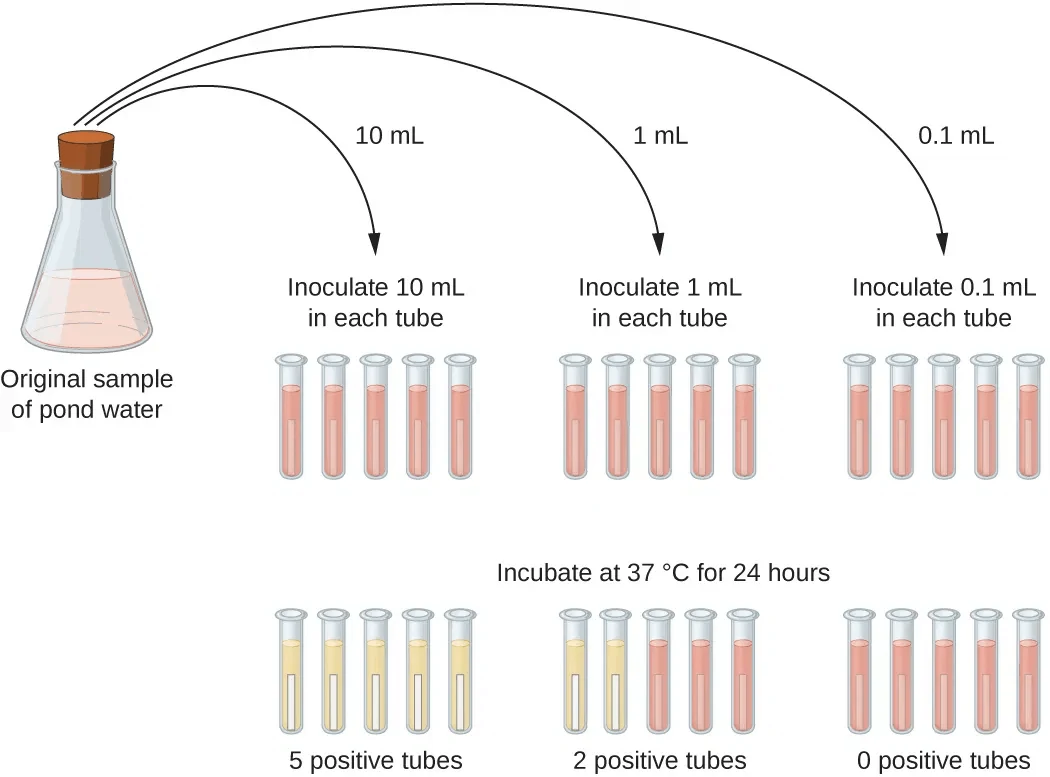
18The oldest of the three methods, estimating concentration statistically from positive reactions across a series of tubes.
SM 9221: multiple-tube fermentation.
The method rests on the fact that coliforms metabolise lactose. A lactose broth, combined with other compounds, reveals that metabolism through gas formation—visible bubbles caught in an inverted Durham tube—and through acid production, which changes the color of the medium.
Testing proceeds in three stages: presumptive, confirmatory, and completed. If no gas or color change appears in any tube during the presumptive stage, the sample is considered safe and the later stages are unnecessary. If they do appear, the positive tubes continue to the confirmatory stage.
During the completed stage, a loopful from each tube that was positive at the confirmatory stage is streaked onto plates of a highly selective medium such as Eosin Methylene Blue. One set is incubated at 35°C for Total Coliforms, where colonies form with a green sheen; another at 44.5°C for thermotolerant E. coli.
The method is both complex and lengthy. It requires substantial glassware and prepared media, and can take four to five days to produce a result.
- Prepare the lactose broth medium in laboratory-grade water, following the SM 9221 protocol
- For treated samples such as drinking water: 10 mL of double-strength medium in each of five tubes, and 50 mL of single-strength medium in a further tube
- For untreated samples such as surface water or sewage effluent: 10 mL of double-strength medium in five tubes, and 10 mL of single-strength medium in ten more
- Place an inverted Durham tube in each test tube so gas formation can be observed
- For treated samples: add 10 mL of sample to each of the five double-strength tubes, and 50 mL to the single-strength tube
- For untreated samples: add 10 mL of sample to each double-strength tube, 1 mL to five of the single-strength tubes, and 0.1 mL to the remaining five
- Incubate at 35°C and examine after 24 hours for gas formation or a color change indicating acid production
19Developed in the early 1950s to replace a labour-intensive method, and giving a direct colony count rather than a statistical estimate.
SM 9222: membrane filtration.
Where multiple-tube fermentation estimates concentration from most-probable-number tables, membrane filtration counts the bacterial colonies in the sample directly. That is why it became one of the most widely used methods in environmental laboratories for routine examination of water and wastewater.
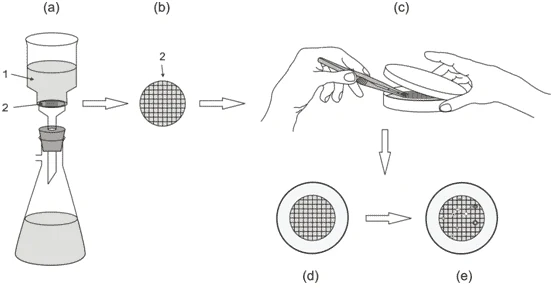
A vacuum filtration assembly holds the water sample above a filter membrane. Once filtration is complete the assembly is taken apart, the membrane is removed and placed in a sterile petri dish on a pad saturated with the required medium, and the dish is incubated at 35°C until colonies form. Colony color identifies the target organisms, and which colors signify what depends on the medium in use.
SM 9222 describes several procedures that share those steps and differ in the compounds used to prepare the selective medium, which in turn determines how the target bacteria are detected.
Overall the method is more versatile, simpler, and more accurate than multiple-tube fermentation. Its limitation is turbidity: it cannot be used on samples where suspended material would block the membrane.
- Endo-type agar containing lactose, for detecting and quantifying Total Coliforms alone
- Dual-chromogen m-ColiBlue24 medium, for detecting Total Coliforms and E. coli simultaneously
- Fluorogen and chromogen MI medium, also detecting and quantifying both organisms at once
20The most recent addition to the Standard Methods, detecting bacteria by their enzymatic action on specific substrates.
SM 9223: the enzyme substrate test.
The working principle resembles the MI procedure used in membrane filtration, where enzyme activity produces a color or fluorescent signature. Quantification, however, follows the multiple-tube approach: tests run across a series of tubes or wells and statistical means convert the positives into a concentration, reported as a Most Probable Number.
For Total Coliforms the method uses the chromogenic substrates ONPG and CPRG. Coliforms produce the ß-galactosidase enzyme, which hydrolyses the substrate and yields a yellow color. Some non-coliforms such as Pseudomonas produce small amounts of the same enzyme and could create false positives, but the medium includes compounds that suppress them, so false positives are generally avoided unless those organisms are present at very high concentrations.
E. coli is quantified using the fluorogenic substrate MUG. The ß-glucuronidase enzyme produced by E. coli reacts with it to create a blue fluorescence under ultraviolet light. Both signals matter together: some strains of other species such as Salmonella also fluoresce, but because they do not produce ß-galactosidase they cannot produce the color change.
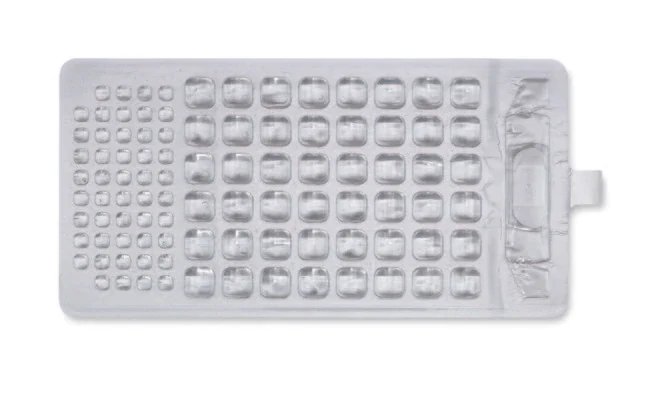
IDEXX Colilert-18 Quanti-Trays are among the most widely used technologies in this category. A 100 mL water sample is added to a dry powder containing the chromogen, fluorogen, and suppressants, shaken to dissolve, and poured across a tray of 96 wells. The tray is sealed and held at 35°C for 24 hours, after which the number of positive wells for each organism is compared against standard tables to give the concentration in MPN units.
Enzyme substrate methods are the simplest of the three and call for the least expertise and equipment. They still require a laboratory, and still cannot deliver results in under 24 hours.
21Collection, handling, and timing determine how much a result can be trusted.
The result is only as representative as the sample.
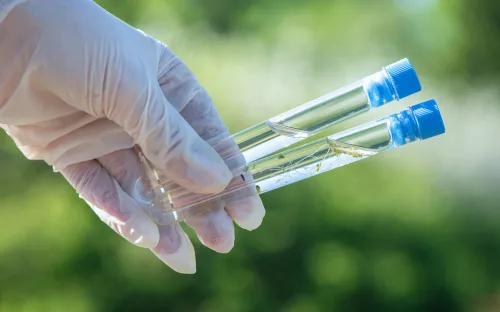
A result describes the sample that was analyzed. Whether it describes the system depends on where and when the sample was taken, how it was collected and preserved, and how faithfully the procedure was followed.
Sampling plans, documented handling, and recorded context are what let one result be compared with another, and what let a change over time be read as a real signal rather than an artefact of method.
Move from result to action
Consider how turnaround time changes operations, then design the complete process around the decision that must follow.
22Every standard method shares two constraints: a central laboratory, and at least 24 hours.
Why faster information changes the operating rhythm.
Regular testing for Total Coliforms and E. coli shows whether water is safe to drink and whether treatment units and the distribution system are working. All three standard methods deliver that answer, and all three require laboratory facilities to house the procedure and at least 24 hours to produce a result.
Requiring a central laboratory puts testing out of reach in many regions, particularly remote and smaller communities. Requiring 24 hours limits what is possible even where laboratories are available, because real-time management needs data that arrives while decisions are still being made.
Boil water advisories illustrate the cost. Around a quarter of them are issued because Total Coliforms or E. coli were found. They are lifted after 48 hours on average, but many run for weeks or months, and in rare cases years—partly because lifting one requires test data, and that data comes from a central laboratory on its own schedule.
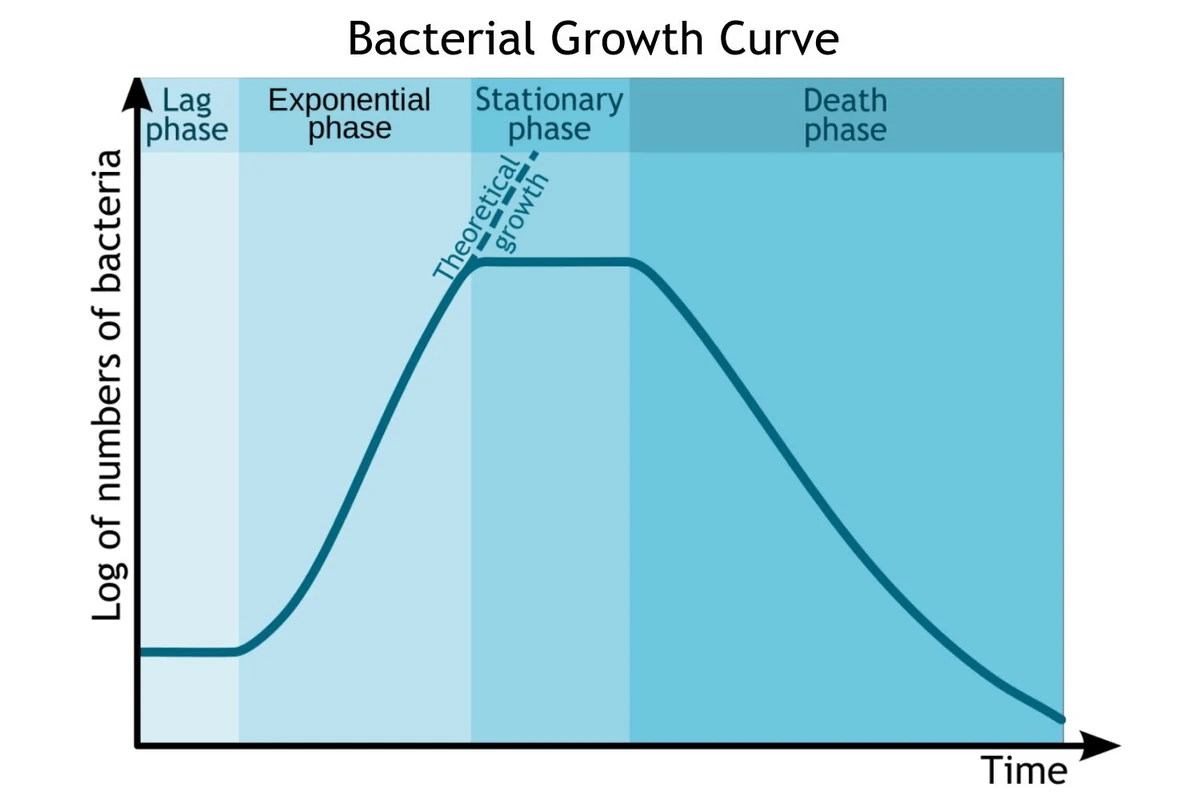
The bacterial growth curve explains where the 24 hours goes. Standard methods depend on the exponential phase, when the cell population has grown large enough to form countable colonies, generate visible gas, or produce a clear color or fluorescence change. Reaching that point for Total Coliforms and E. coli takes 24 to 48 hours.
Working earlier in the curve is what shortens the wait. During the lag phase, cells retain normal metabolic activity while remaining far less numerous than in the growth phase. Sensor nanostructures engineered to be highly sensitive to that metabolic activity can detect it well before the population becomes visible, and a blend of suppressants in the test reagents provides the selectivity needed for the result to mean something specific.
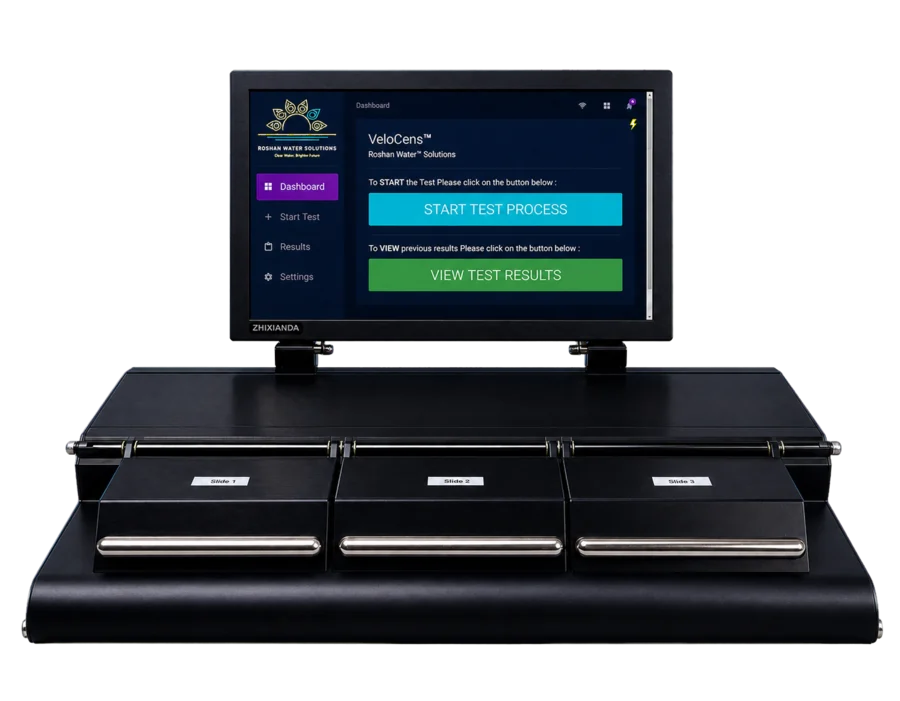
This is the approach behind VeloCens™, Roshan Water's portable system for quantifying E. coli and Total Coliforms closer to the point of need. Product specifications and current capabilities are described on the VeloCens page.
- Lag: the initial phase, where the original population uses available nutrition and prepares for cell division
- Exponential: cell population increases sharply through binary fission, with metabolic activity at its highest
- Stationary: growth slows as nutrition is depleted and waste accumulates
- Death: the rate of cell death overtakes the growth rate
23Access to clean and safe drinking water is not a problem any single organization solves.
A global challenge needs global initiatives.
Alongside companies working on the technology, large local and global initiatives target the places where safe drinking water is a daily challenge.
One of the most significant is UNICEF's Rapid E. coli Detection Project, which aims to empower communities and government partners with information about water quality so they can treat unsafe sources and identify where improvement is needed. The project seeks technologies that test for E. coli on site and within a few hours.
A principal application is household water quality surveys in the countries UNICEF supports. Roughly 100 surveys are conducted each year, each covering about 50,000 homes—on the order of a million water tests annually.
Non-profit organizations including Humanity First and Ryan's Well Foundation work in rural areas across Africa and South East Asia, building wells and hand pumps under sanitary conditions so communities can reach safe drinking water without travelling kilometres for it.
24Monitoring quality through testing is the first step in resolving a challenge that remains global in scale.
Build the workflow around the decision you need to make.
More than 2 billion people use a drinking water source contaminated with feces, associated with about 829,000 deaths annually. Diarrheal disease claims roughly 5,000 children each day, with close to 1,200 of those deaths linked to unsafe drinking water.
Efficient strategies increasingly point toward decentralised, rapid testing that supports decisions while they are still being made. What matters in practice is matching the method to the question: what is being decided, who decides it, what evidence that decision requires, and how quickly it must arrive.
Established laboratory methods remain the foundation for defensible results, and portable tools are evaluated within that context rather than apart from it.
- Water covers about 71% of the earth's surface, but only 2.5% is fresh water, and roughly 0.5% is available for use
- More than 2 billion people use a drinking water source contaminated with feces
- Unsafe drinking water is the leading cause of diarrheal death in children, with almost 1,200 deaths per day
- Up to 18 million cases of waterborne disease are reported in North America each year
- At any given time, one in five Indigenous communities in Canada is under a form of drinking water advisory
- Wastewater reuse and recycling, quality monitoring, conservation, and action on climate change all reduce water stress
- E. coli and Total Coliforms are indicator organisms, signalling both the possible presence of pathogens and the effectiveness of treatment
- Bacteria most often reach water through inadequate treatment, sewage overflow, failing sewage systems, and agricultural or stormwater runoff
- Microbiological examination in central laboratories yields results at least 24 hours later
- Real-time decisions depend on data that arrives in time to inform them